1. Introduction
Welcome to VolleyStation Pro user manual, the comprehensive source of knowledge about inner workings of our software. This manual covers all the functionalities of VolleyStation Pro 1.23.2, and will be updated as new versions are released.
We would also like to invite you to follow our blog and social media platforms: YouTube, Facebook, and Twitter. They are a great source of practical, helpful tips for everyday use. If you have any questions or suggestions, don’t hesitate to contact us at contact@volleystation.com.
1.1 System Requirements
You can use VolleyStation PRO on the following operating systems: Windows 10, macOS (Catalina or Big Sur), and Linux. For proper functioning, we recommend the following system requirements:
- Dual-Core Intel i5 1.8 GHz,
- 4 GB RAM,
- 1 GB of free space,
- Display resolution 1600 x 900 (the minimum supported is 1280 x 800).
VolleyStation Pro verifies the license using the Internet connection. It is an automatic process, and it does not require user interaction. The software can be used without the Internet connection (in an offline mode) for seven days from the last license verification.
1.2 Demo account
To access the demo version, please use this website and fill out the form. The demo version has all the functionalities of the VolleyStation PRO full version.
1.3. VolleyStation account
If you have a VolleyStation account, you can log in from this page. After login, you can download the VolleyStation installer in versions dedicated to Windows, macOS, and Linux operating systems.
If you are part of an organization that uses group licensing, you will receive all the necessary login information by e-mail.
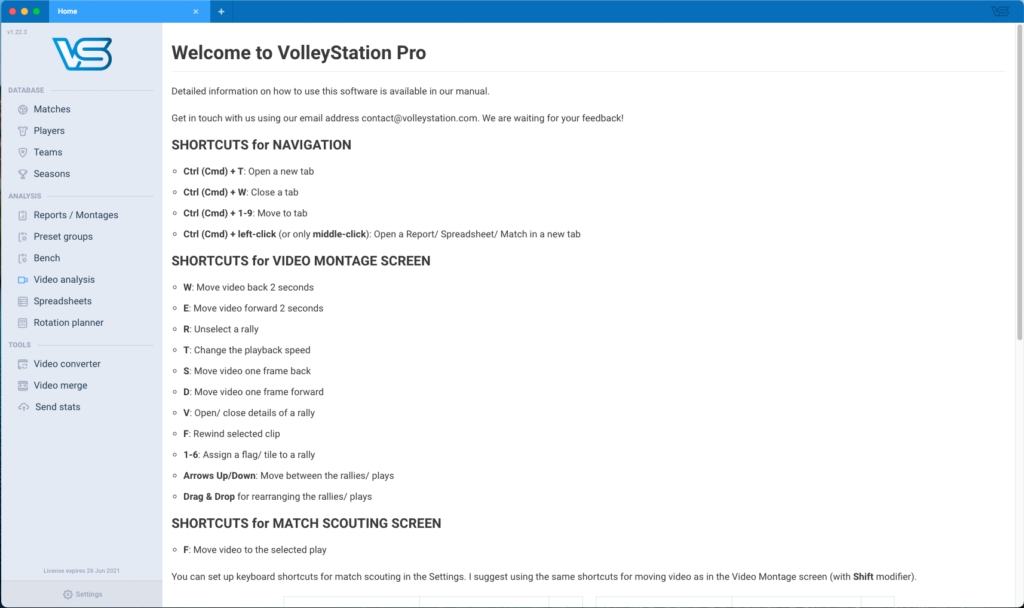
After launching and logging into VolleyStation PRO, you will see the following screen.
2. Settings – preparing the program for daily use
There is a Settings button in the bottom left corner you have to click to move into the more detailed page with all VolleyStation PRO settings.
2.1. Preferences

At the top right, we have placed the Logout button, which allows you to leave the active user’s account. Any existing data in VolleyStation will remain available for the next logged-in user.
There are three checkboxes below:
Language is the place where you can select the language versions of the program.
Card mode applies only to people coding matches using cards, which is described in chapter 6.3.5. There are two types of cards: basic and advanced.
The coding mode option is for people who use codes to input statistics. When coding matches, the program automatically synchronizes codes with the video.
Predictive mode is designed for beginners. It synchronizes the service when the user enters the first rally sign. Each following code in action automatically syncs with the addition of a one second to the previous one.
Raw mode is designed for advanced users. It synchronizes each code exactly when entering the first character from the string. The real-time function is dedicated especially to people who are proficient in coding and do it at a similar pace to the events on the court. The synchronization can be modified at any time. You can read more about that in chapter 6.3.6.
2.1.1. Keyboard shortcuts
The VolleyStation has built-in hotkeys that cannot be changed. These include shortcuts to help navigate bookmarks:
- Ctrl (Cmd) + T: Open a new tab,
- Ctrl (Cmd) + W: Close a tab,
- Ctrl (Cmd) + 1-9: Move to tab,
- Ctrl (Cmd) + left-click (or only middle-click): Open a Report/ Spreadsheet/ Match in a new tab.
Shortcuts for video montage screen
- W: Move video back 2 seconds,
- E: Move video forward 2 seconds,
- R: Unselect a rally,
- T: Change the playback speed,
- S: Move video one frame back,
- D: Move video one frame forward,
- V: Open/ close details of a rally,
- F: Rewind selected clip,
- 1-6: Assign a flag/ tile to a rally,
- Arrows Up/Down: Move between the rallies/ plays,
- Drag & Drop for rearranging the rallies/ plays.
Shortcuts for match scouting screen
- F: Move video to the selected play.
Shortcuts for command line (for away team use the ‘a’ prefix)
- C11:24 Substitution for home team (11 out: 24 in),
- T Time-Out,
- Z1 Change home team setter to player in Zone 1,
- I2 Move the home team rotation to 2,
- P Assign a point for the home team (used at the end of rally, instead of using the shortcut for assigning a point),
- Shift+Enter Allows to put a code with error.
Shortcuts for play list
- Insert (CMD + I): adds a line to input a code after current play (use shift to add code before current play),
- Delete: deletes a highlighted code,
- Ctrl+Arrows Up/Down: moves between rallies,
- Shift+Arrows Up/Down: moves between searched plays (if you used the Search tool).
We suggest that you remember these shortcuts, as they will help in easier navigation, video analysis, and efficient coding. In the settings window, you can change the keyboard shortcuts of symbols used in coding, which is crucial for the user’s work style. At this point, you have complete freedom to define your keyboard shortcuts. The image below shows two examples of such use.
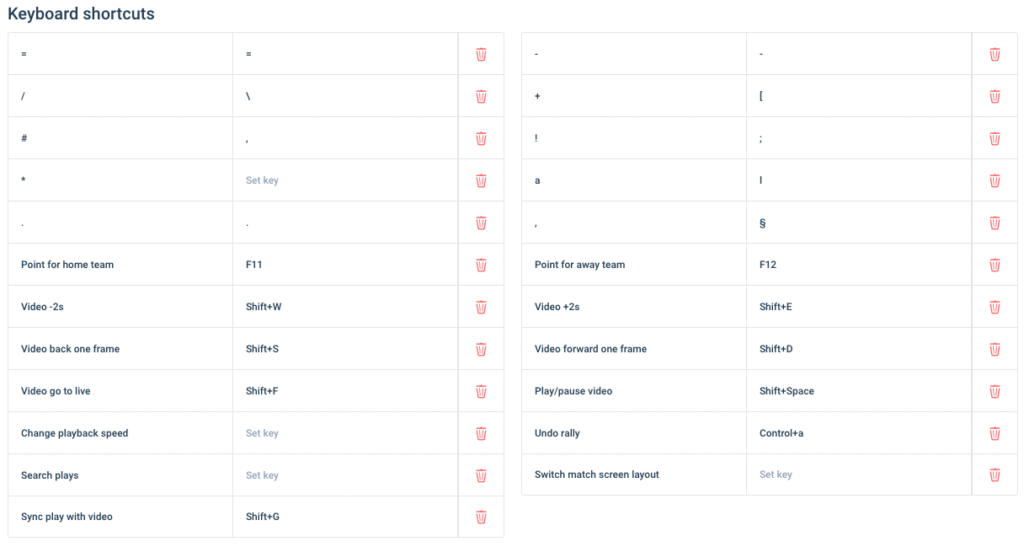
There is also an option to create your own shortcuts that will be applied during match coding. This option allows you to set any keyboard shortcut to one or more characters (codes). For example, you can set a hotkey for the code *11D#. The Enter key cannot be set as a hotkey. Here is an example of using a coding shortcut:

The keyboard shortcuts used in operating systems are also used in VolleyStation. For example:
- Ctrl (Cmd)+ C → copy,
- Ctrl (Cmd) + V → paste,
- Ctrl (Cmd) + X → cut.
2.2. Default codes
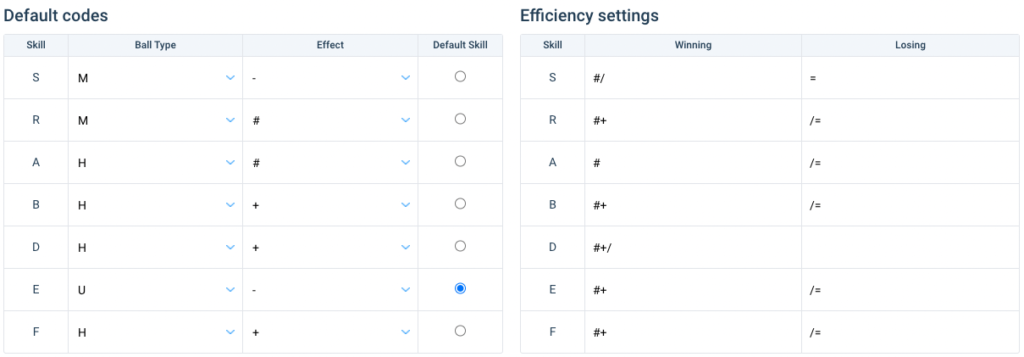
The default codes are a way to enhance and speed up your coding. They are used to optimize and increase coding efficiency. Thanks to them, it is possible to enter fewer characters because VolleyStation will automatically add the missing ones. By default, entering the letter S corresponding to the service, the program will add information that it was an M (float) service type, with a positive effect (+). We can edit the default codes and set both: type of play and its effect. In addition, we can specify a default play. In the image below, play (E) is set as the default play. Because of this feature, typing a14 in the match window, VolleyStation will interpret it as a14EH+.
2.3. Efficiency
It is also possible to set efficiency assumptions. Efficiency is the difference between winning and losing plays divided by the total number of plays of a specific element. The efficiency parameter helps to realistically evaluate the profit and loss calculation, how it differs from effectiveness.
2.4. Match flow
Volleyball is a very complex sport that can be modified and adapted to your requirements at the same time. Therefore, to better prepare for the needs of your team, we have introduced the function of creating your match coding system. Until now, the program has followed strict coding rules, disregarding individual needs. This was especially noticeable in the match validation, which showed many errors every time the stats deviated from the standard coding path.
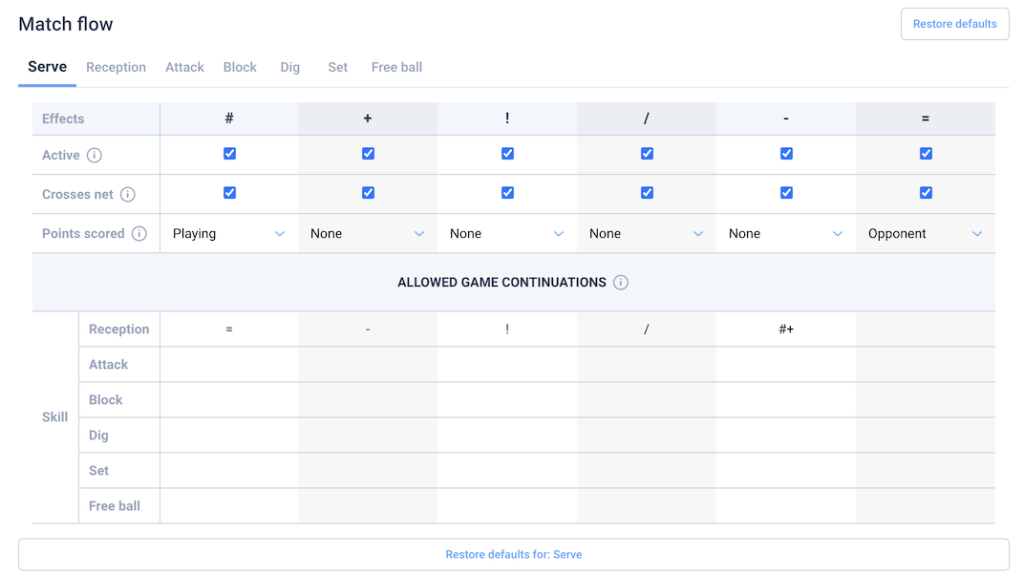
Tabs at the top allow you to select a volleyball element that needs to be individually set. Below, all possible effects are listed in the columns, and in the lines, we have three options: “active”, “change side”, and “scorer”. By checking the box in the active line, we inform the program that we use this effect with the element selected in the tab in coding matches. If the box is unchecked and the effect appears in the code, the validation will show the error as an invalid effect.
By checking the active field “change side”, after performing the given effect in the selected element, the ball goes to the other side of the field. For example, if we write service aces as #, this field should be unchecked because the ball no longer returns to the server’s side. However, if the effect / is for us the ball to be accepted to the server’s side, the switch side option must be activated.
The last option – “scorer” – allows you to determine if and if the team scores the point after performing a given effect. It can therefore be a chosen “nobody”, “executor”, and “opponent”. For example, for service aces (#), we should mark “executor”, for service errors (=) “opponent”, and for other cases, “nobody” should be marked.
The last part is a section that allows you to determine what codes can follow a specific effect of the selected item. So if we chose the “attack” tab, for example, it could be followed by codes as shown in the picture below. Of course, each statistician can determine their coding style. We can return to the built-in settings at any time. To do this, use the “restore defaults” button. If only one effect has been selected for effect in the continuation item, it will be automatically recognized by VolleyStation and used for dot encoding.
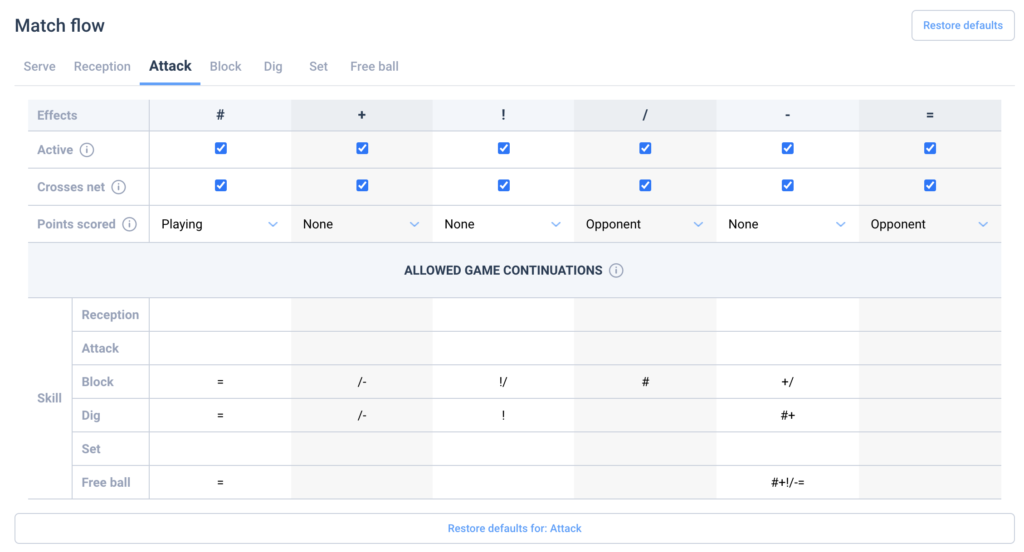
Changes to the flow of the match change the logic of VolleyStation in areas such as:
- dot encoding,
- code validation (error list),
- entering codes in card mode,
- arrows colors used in heat maps and sheets,
- calculations in numerical reports.
2.5. Combination maps
The last section in the Settings tab gives the ability to create combination maps. If the codes in the imported match vary from what we use, we can change them very efficiently by adding the so-called “Combination map”. Once set, we can use them many times.

The following window will pop up by clicking on the Add Combination Map button shown in the image above.
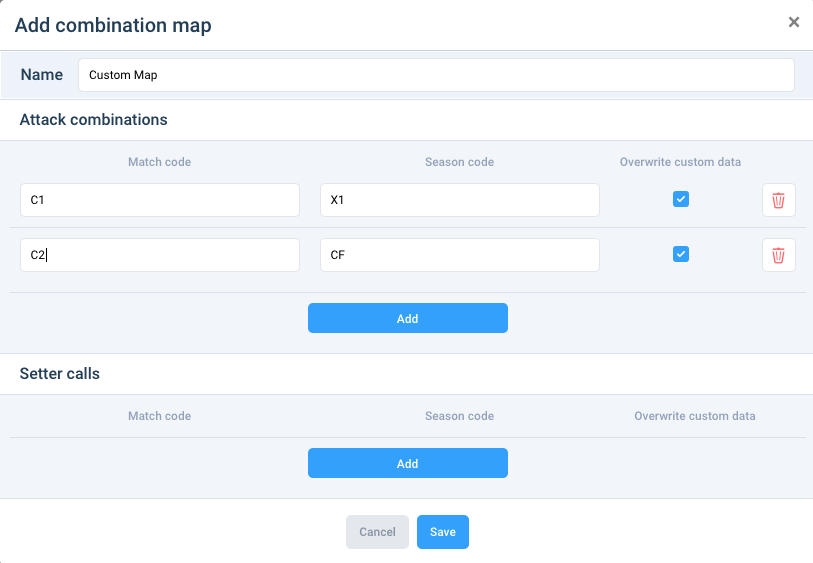
To create a combination map, it should be named in a way that will allow us to identify which matches we can use it for. In the Attack combinations and/or Setter calls sections, we must use the Add button. In column “Match code”, select the codes to change. In the “Season code” field, enter the codes you are using. After creating your combination map, remember to use the Save button. To change an existing combination map, click on its name in the field visible on the list of “Combination maps”.
Combination maps can be created similarly in the match window by clicking on the code converter (chapter 6.3) or in the matches list using the icon (code converter) placed next to the match creation date column (chapter 6). We suggest using combination maps just by tab matches the coding screen itself.
3. Season
The Season tab is on the left side of the VolleyStation main window. It allows keeping order in the match database. By creating several seasons, we can import and create matches in dedicated competitions. This is especially important for users who work with more than one team at the same time. For example, when they follow different volleyball levels in a given country or age categories.
3.1. Creating a new season
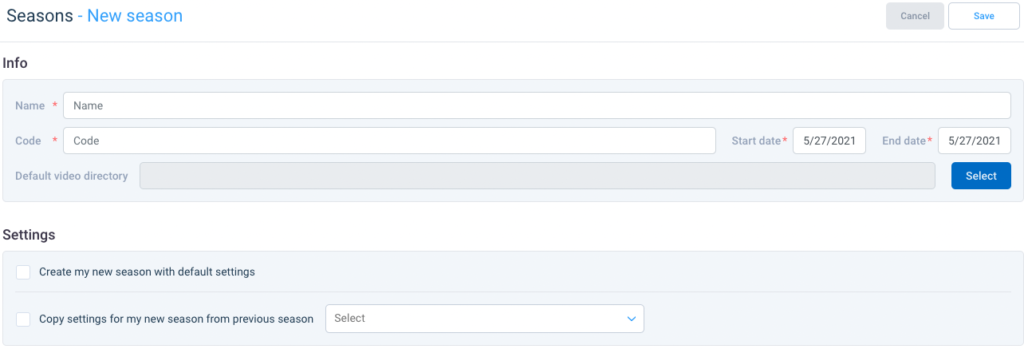
To create a new season, go to the Seasons tab and then use the New Season button in the upper right corner. The above image is a mirror of the window that will open. The first four fields are necessary to create a new season:
- Name – a short and legible description of the games (e.g., Plusliga 2020/2021).
- Code – short and unique description of the season (e.g., PLS20/21).
- Start date and end date – specifying these dates allows for the correct chronology of displaying the seasons.
- Default video directory – allows choosing the default directory where we will store video files. By importing matches from the PLPS or VolleyMetrics servers and downloading the videos from them to the default directory, will allow VolleyStation to link them automatically. Please note that you cannot change the default filenames.
- Create my new season with default settings – an option for people who are just starting their adventure with VolleyStation.
- Copy settings for my new season from previous season – allows to select settings from the existing season (with specific solutions) for a newly-created season. We recommend this option for people who have been using VolleyStation for a long time.
Using the Save button will take you to the next stage.
3.2. Selecting and adding new bases and attack combinations
After completing all steps from chapter 3.1, the following window pops up. Default setter calls and attack combinations represent the most common marks used in worldwide volleyball analysis.
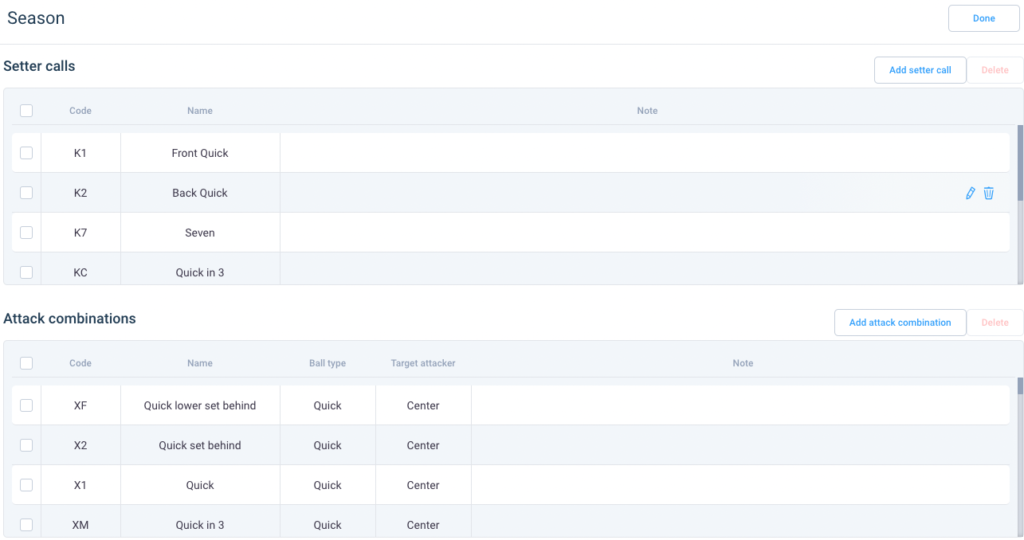
To add a new setter call or attack combination, use Add setter call or Add attack combination button. If you are adding a setter call, select the code for that call that you will use during the coding process or their search. The base code must begin with the letter ‘K’ (that’s why we call them K-codes). It’s important to enter a brief description to help you easily understand the meaning of this code. In the playfield shown on the right, select the setting area.
The process of creating new attack combinations is similar. In the window that appears, select the code for this combination. It will be used during coding or searching. You can also enter a brief description to verify this code quickly. It is also necessary to select the ball type from a drop-down list of seven ball types. It is handy for analysis to choose the direction of a set, which will add this information to the previous set skill. It’s done by selecting whether the attack is from the left-wing, center of the net, right-wing, pipe, or is a setter attack. On the court shown on the right, you should also mark the area where the attack is performed. At the end of the season creation process, click Done in the upper right window.
3.3. Modifying seasons

To edit a season’s data or delete it, hover your cursor over its name in the Seasons tab, and three options will appear on the right side of the bar. Clicking the first takes you to edit the season data. The second is to edit the setter calls and attack combinations. The third one allows you to delete the season. Further steps are analogous to those presented in chapters 3.1 and 3.2.
4. Teams
This tab allows you to see all previously created or imported teams that are in the database. Clicking on the team name will open a list of all its matches.
4.1. Importing teams
There are two ways to import teams. The first is to click the Import button located in the top right corner. Use the Select Files option or drag them to this location. You can select or drag more than one team. When importing, the teams and players will be automatically added to the database.
Teams are added automatically when you import matches. See chapter 6.1 for more information.
4.2. New team
To create a new team, use the New team button. It will open a form where fields such as name, code, season, and coach (first and last name) are necessary to fill out. After saving the data, an empty list of players will appear in the next step. To add them, use Edit roster and add. The necessary data are:
- No – the number of the player.
- Code – The player code must be unique for each player. VolleyStation recognizes players by these codes. If VolleyStation supports the competition, these codes will be provided by the competition organizer. If there is a need to create a team without player codes, we suggest using the first three letters of the last name and first name separated by a hyphen to minimize the risk of code repetition. For example, a player named John Smith would have the code SMI-JOH. This is one of the most commonly used systems in volleyball.
- Name;
- Surname;
- Position – specifying the player’s role is essential to automate certain actions of the program. It will be possible during match creation, match coding, and analysis generation.
After filling in the necessary data, you can use Add to enter the data of another player. If the whole team is filled in this way, use the Save button.
4.3. Modifying teams
To edit team data or delete a team, simply hover over its name in the Teams tab, and three options will appear to the right of the bar with the season name. Clicking the first option ( ) will take you to edit a team, the second option (
 ) allows you to merge two teams (see chapter 4.4.), and the third (
 ), is to delete a team.
4.4. Merge teams
This option allows you to merge existing teams and their matches. This handy feature allows you to create analyses of teams playing under different names in different competitions. Clicking the  (merge teams) icon next to a team opens a window where on the left the selected team is visible, and under it, the list of players. On the right side, you have to choose the name of the target team and below each player his counterpart from the target team.
5. Players
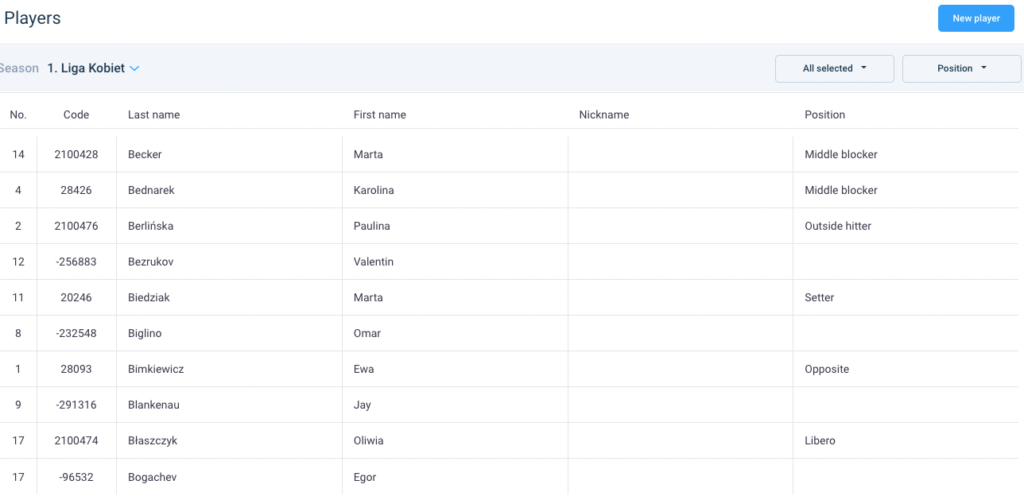
The Players tab on the left side of the screen takes you to the database directly related to them. It shows a list of players with the selected season. Clicking on a player will open a list of games where the player was playing.
5.1. New players
To add a new player to the database, you have to click the New player button. It is necessary to fill in the fields that have a red star next to them. We suggest that you add new players by editing the teams in the teams’ tab. This helps avoid unintentional user errors. Moreover, you should pay special attention to the player code and correct position of the player. In the create new player window you can enter date of birth, height, weight and range in attack. After filling in the form fields, confirm the player by clicking Save. It is possible to input player with number 0.
5.2. List sorting
The list in the players menu is sorted by alphabetical order of last name. When using the Season drop-down box, we can display players from the given games only. On the right side, there is also an option to filter players of one or more teams. Position allows us to display a list of players in specific positions.
5.3. Modifying
VolleyStation allows you to edit players quickly. Hover cursor over a player’s data to display three icons on the right. Clicking on the first one ( ) will take us to a familiar form that allows us to edit his data. The icon (
 ) allows you to merge two entries for the same player. The third icon (
 ) is a definite deletion of a player from the database.
6. Matches
Creating matches is the primary functionality of VolleyStation for creating a database. There are two methods of adding matches to the program, which will be discussed in the following subsections. Matches tab on the left opens a list of all matches within the selected season. You can also filter the list by clicking on the right side of the Team window, which will open a list of teams within the season. Selecting one team will open a list of all its matches. Selecting two teams will list the matches between these two teams. Selecting three or more teams will show matches between any of the selected teams. By highlighting a match with the cursor, you will see icons on the right hand side:
![]() Match editing,
Match editing,
 Exports the .dvw file to any location outside the program. It is worth noting that after exporting to a file, subsequently written codes will be automatically added to the previously created file,
 Exports the .XML file for use with Hudl Sportscode. It is notable that after exporting file, then written codes will be automatically added to the previously created file,
 Swaps sides of the match. The host turns into a guest, and the guest turns into a host,
![]() Allows you to generate a match report without having to open the match,
Allows you to generate a match report without having to open the match,
![]() Permanently removes the match from the database.
Permanently removes the match from the database.

6.1. Import
If you have a .dvw format file, you can import it into VolleyStation. To do this, simply click Import on the right side of the window. New window will open where we can select one or multiple files from the disk by Select Files. You can also drag and drop the selected matches into this place. During the import we add the teams and players to the database as well.
6.2. New match
Without having a .dvw file, you need to create a new match and code it yourself. To do this, use the New Match button, which will open the form. The data marked with a red asterisk are mandatory for saving the match. The first step is selecting the Season. Specify the date and time of the start of this match, as it will allow for a good match sorting. The Key field allows you to enter an alphanumeric string received from the organizer, which allows the match statistics to be automatically updated on designated servers.
Next, select both the home and away teams. At this point, it is also possible to change the data of the staff members.
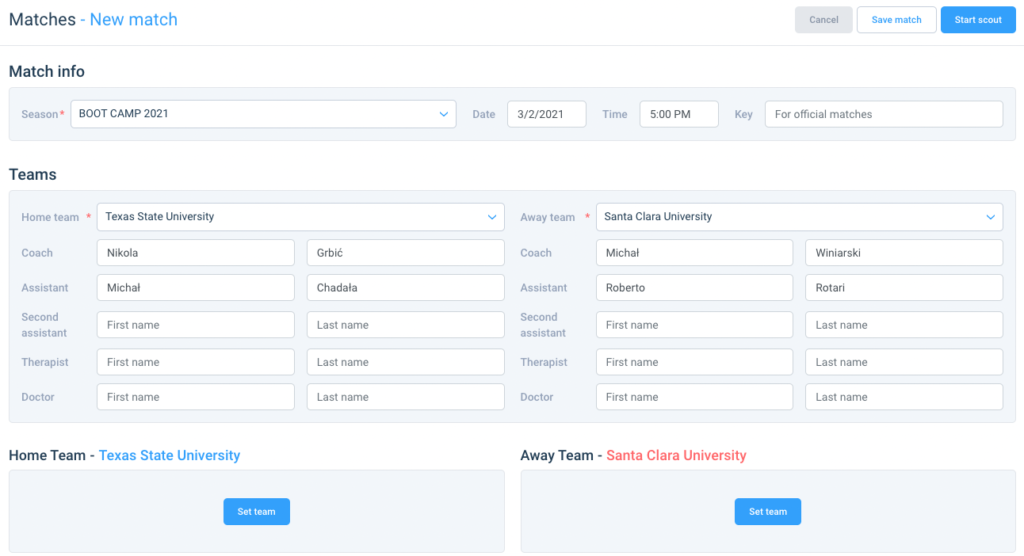
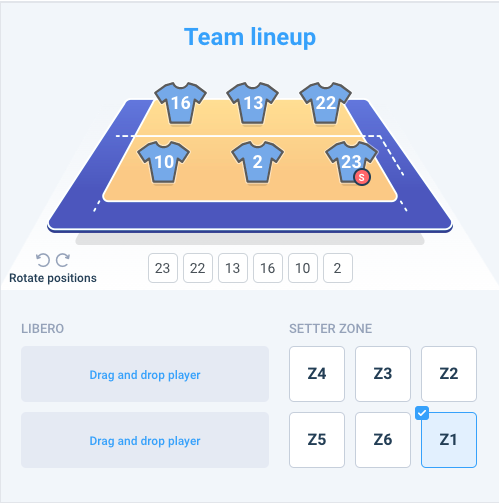
In the next section, click on the Set team button, and a list of players will appear. To select the starting six for a match, simply drag a player from the list on the left to the appropriate spot on the court. The other ways of inputting players into the roster are double-click on a player and inputting player numbers directly on the Z- fields below the court.
![]() The rounded arrows marked as rotation positions allow for changing the position of the whole team. If there are setters in the team roster, they will be automatically selected. You can change the setter by clicking on the zone (e.g. Z1) under SETTER POSITION. If there are liberos in the team roster, they are automatically added to the LIBERO zone. You can remove them by dragging another player from the list into their place. The player list is modified by the Add player to a roster button. The procedure for selecting a player must be repeated for the away team. IMPORTANT: in order to save the game, it is necessary to mark the setters of both teams. To finish this step, use the Save Match or Start Scout buttons depending on what you want to do in the next step.
The rounded arrows marked as rotation positions allow for changing the position of the whole team. If there are setters in the team roster, they will be automatically selected. You can change the setter by clicking on the zone (e.g. Z1) under SETTER POSITION. If there are liberos in the team roster, they are automatically added to the LIBERO zone. You can remove them by dragging another player from the list into their place. The player list is modified by the Add player to a roster button. The procedure for selecting a player must be repeated for the away team. IMPORTANT: in order to save the game, it is necessary to mark the setters of both teams. To finish this step, use the Save Match or Start Scout buttons depending on what you want to do in the next step.
6.3. Encoding screen
6.3.1. Menu
 Save & close match,
 Comment – opens a window with a text field,
 Edit roster – opens a window where you can change player data or add new players to the match list,
 Substitution – opens a selection window. To make a change, select the team in which it occurs, select a player leaving the field and in the last column a player entering,
 Synchronisation – opens a window, where you can add timestamps to the codes. More about synchronization in chapter 6.3.6,
 Error list – opens a list with listed errors or deviations from the match flow functions,
 Search – opens the code search window. More about this in chapter 6.3.2,
 Code Converter – allows you to change the codes if the imported file contains deviations from your season data. The first column shows the codes used in the match, and in the second column you select the target code. The third column allows you to uncheck the codes that do not need to be changed. More on this in section 2.4 Combination maps,
 Connect tablet – opens a pop-up window with a link to copy on bench devices. There is also a QR code to take a photo using a tablet,
 Live export – allows you to save the match in .dvw format to a location of your choice,
 Media live – allows you to save the match in .vsm format to a location of your choice,
 Sportscode Live – allows you to save the match in .xml format at the selected location,
There are two additional options at the bottom of the menu:
- Screen Layout (Scout / Show / Synchronize) – changes the screen layout to suit the user’s preference.
- Scouting mode (Codes / Cards) – changes the way to input data. We recommend sections 6.3.4. and 6.3.5. to learn more about these.
6.3.2. Search
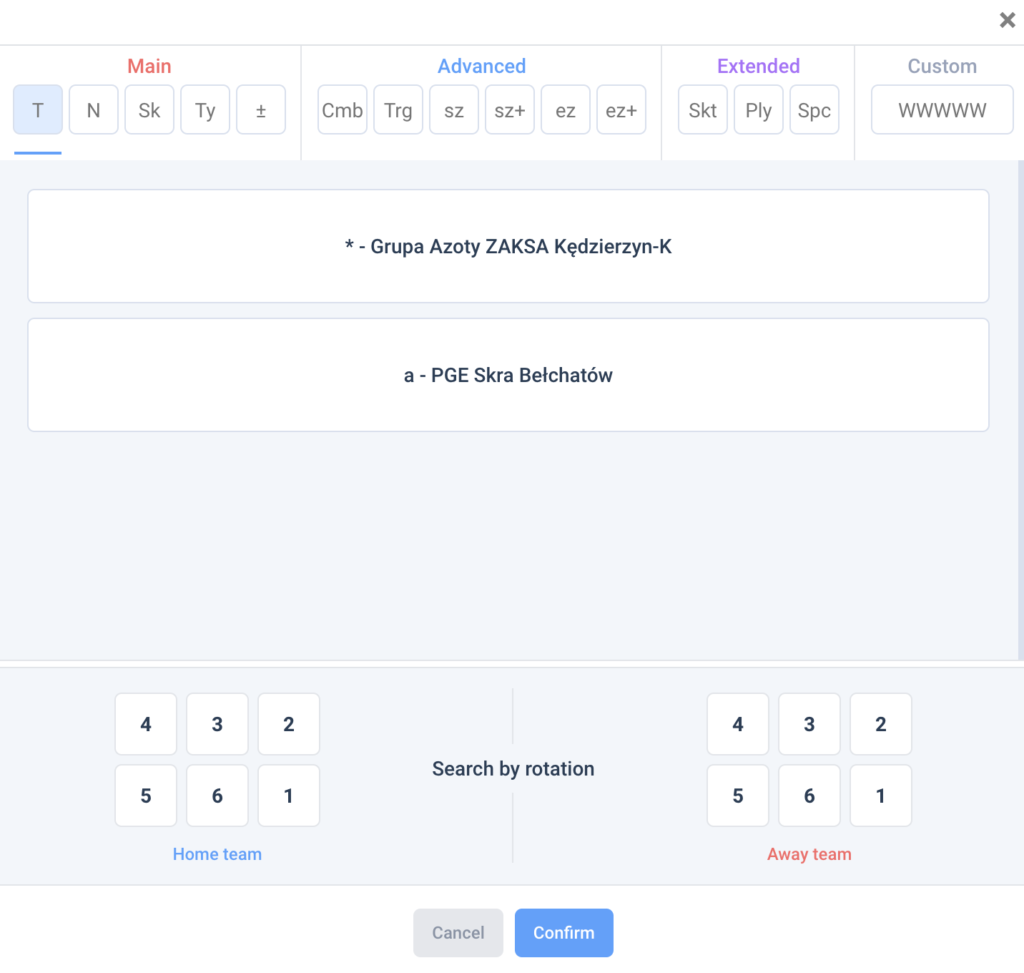
If we need to search for specific codes in an open match, select Search in the menu on the left. A new window will pop up. You can enter the desired codes in the text box or select them by pressing the hint boxes below. You don’t need to fill out the whole code. At the bottom is the section Search by rotation. Checking it allows selecting the desired settings for both teams. After confirming the search, the window will close and the searched actions will be highlighted in the match window.
6.3.3. Match Window
The match window contains the necessary functions for creating a coded record of a match. If you have a video file or use VolleyStation Streamer, you can add the video recording by pressing Add File or Add Streaming address button.
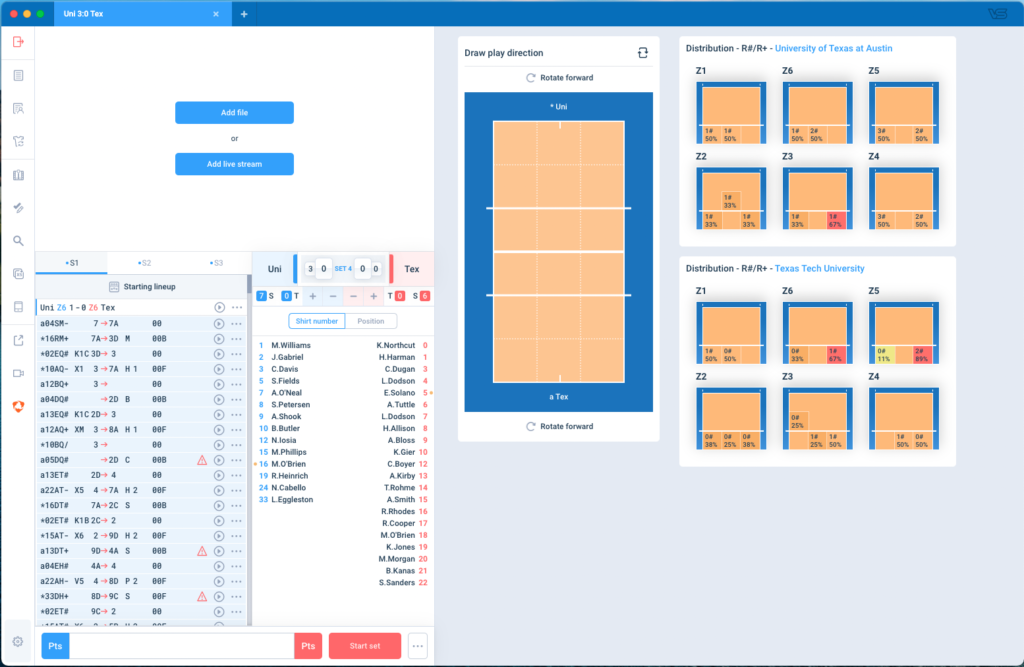
Below the video panel, you can see a tab with the available match codes for specific sets. We will only see S1 (set 1) at the beginning of the coding, but as more sets are created, more tabs will be added. Selecting a part of the match will display its code. On the right are the match score and the list of players which can be sorted by shirt number or position.
On the top of the code list, there is ‘Starting lineup’ which allows you to choose or change starting positions of players.
- S (substitution) opens the substitution window
- T (time-out) adds an indication to the code that the team has requested a time-out
- + adds a point to the selected team
- – subtracts a point from the selected team
On the right side of the screen there is a court that is used to map match events. This is where we can draw arrows to specific codes. Select the code on the left, and then specify the start and endpoint of a play. The court also shows jerseys with the numbers of the players that are on the pitch. If we want to add (map) an arrow for attacks that are described by types (e.g. X5), there is no need to mark the starting point. The arrow concerning reception can be generated automatically. However, it is necessary to create the arrow for the serve and the set after reception.
Below the large field there is the breakdown of setter distributions of both teams after a good (+) and perfect reception (#). At the bottom left of the screen there is a coding box. This is where we enter the following action codes. The buttons:
 assigns a point to the home team,
 assigns a point to the visiting team,
 opens the possibility to encode a new set,
 allows you to select options: Open set, Delete set, Card mode.
6.3.4. Match Coding
Creating a match using codes is a standard at the highest level of volleyball. Codes allow you to enter a large amount of data in a short amount of time. In addition, it is the only option for entering basic, advanced, extended, and custom designations of a given play during a match.
Typing each element relies on the repeatability of the entry. Entering a string of characters is analogous for each volleyball element, and their length is related to the complexity of the code being entered.
For example, the code:
- a10SQ#15 is the play of the opposing team (a),by a player with the number 10, who made a jump (Q) serve (S). Its effect is a direct point (#). The server was made from zone 1 to 5;
- *7RQ#13B is a reception (R) of jump service (Q) by the home team player (*) with the number 7. It was made perfectly (#) it zone 1 to zone 3B
- *14K1F! → the home team player (*) with number 14 sets the ball to the left wing (F) with a triple block (!). Middleblocker was running a Front Quick (K1).
There is a lot of automation in the program. It is related to the default codes defined in section 2.2. Entering only K1, the program will interpret as a high ball (H) made by the home team’s setter (*) with the middle blocker passing in front of the setter(K1). The following attack had a double block (+) on the play.
Service-reception, attack-block, and attack-defense form special blocks that always follow each other. To simplify coding, we can use a dot (.) to separate the two plays:
a14SQ15.16# will be interpreted as a service (S) from a jump (Q) played by the guest player (a) with number 14 from zone 1 to zone 5, which was perfectly reception (#) by the home player with number 16. The dot carries over to the other team, so there is no need to use the prefix * or a.
a14X54A.16# A fastball attack from the fourth zone (X5) by the visiting player (a) with the number 14 in the direction of zone 4A. Dot (.) carries over to the other team and so the home player with the number 16 made a perfect (#) block.
a14V56D.16D= an attack from a high ball from the fourth zone (V5) made by guest player (a) with the number 14 towards zone 6D, was ineffectively (=) defended (D) by the home player with the number 16.
The home team marking (*) can be skipped in the code. If there is no character in front of the player number, it will automatically interpret the play that belongs to the home team player with the corresponding number.
A comma (,) allows you to type more characters in your code. This rule applies to a string of characters not separated by a space. The last few characters of each code allow you to enter your own characters, which will not be interpreted in any way by the program. It is possible to use up to five characters. This is often used to create more advanced analysis or to mark specific plays.
6.3.5. Card mode
Card mode is dedicated to those who are not knowledgeable about the codes in the program. It provides the best solution for coaches who need basic analysis for their team’s training needs. To use it, simply move the cursor to the left side of the screen, and in the expanded window, select the Cards bar at the very bottom. Clicking on this button will expand the window illustrated in the image below.
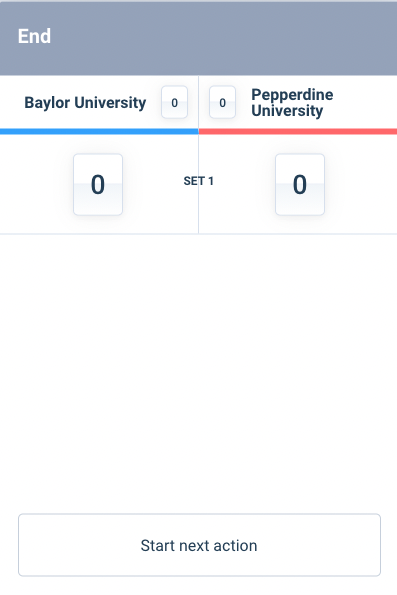
The rest of this subchapter deals with the basic card mode that we can select in Settings. At the beginning of a set, we always have to set up a line up and designate the starting line ups of both teams, as shown in the section “New match” (6.2.) and confirm with Finish. To enter your first action, click on Start next point and then follow the further instructions. We select the player who plays this action, and we indicate the effect of his serve. If the service did not end in a direct error, you will be asked about the player who received it.
Next, we can choose which volleyball element we need to record. For each play, we first select the player who made it, and then we specify its effect.
NOTE: If advanced card type is selected in the settings, VolleyStation will also ask for the start and end zones of each element when writing the action.You have to indicate the types of balls in the attack and the direction of a set. When marking an attack, indicate the type of attack (Hard, Soft, Tip). Like the coding type, the card type takes a lot of skills and practice to get to the level of recording actions on the fly during a match.
6.3.6. Synchronization
In the coding screen, the next option available is Synchronization. Clicking on it will open a window similar to the “Show” screen layout. An important role here is played by keyboard shortcuts, which have to be set in the settings (chapter 2.1.1.).
In addition, the right and left arrows move you between sets, while the up and down arrows help you move between plays.
Once you have selected a particular code and selected a place for it in the video, simply use the keyboard shortcut of your choice to set the time for that play to match the time of the displayed video. Clicking will also automatically move you to the next play. NOTE: when setting the timestamp for an attack, it will assign the same timestamp for the following block (if any). However, this rule does not apply in the offense-defense relationship because the time between touches is slightly longer.

Using the Mark next plays button will synchronize the selected and all consecutive codes to the specified time on the video recording. The time intervals between the codes will be maintained between successive codes.

The Reset sync button deletes an existing synchronization.
7. Reports / montages
One of the basic functionalities is to create reports and montages based on your database of matches. This is a very intuitive functionality that allows beginners to quickly and easily generate analyses and quickly prepare the requested information.
To use these features, select the Reports/Montages tab from the main window located on the left side. It will open a list of recently created analyses. In this window, we can change the Season and also filter the list of analyses by teams and report types.
To create a new report, click on the New report button to open a new window, which will guide us step by step through the process of creating our own analysis. In the Select Report Type box, you will find the types of analysis, which will be explained later. You can also select the season, team, and a list of specific matches to analyze in the select window. The last part is the option to choose filters (explained below). After selecting all the filters, click Generate Report. Clicking Generate again will open a new tab with the last selected properties. However, the previous tab will remain open. When opening each analysis, a Print option appears at the top of the page, allowing you to export to a .pdf file.
7.1. Match report
One of the most used analyses is the match report. It is a summary of the match divided into sets and individual points. The tables show the players and their performance broken down by elements. In the section at the bottom of the page, we also have a table that shows the point ratio in each set and attack after different types of reception.
7.2. By skill
It’s a basic breakdown of the selected team. It presents each volleyball element (rows) with a breakdown of the effects of its execution (columns). The columns show the efficiency, the total number of every element, and the percentage breakdown of each effect
7.3. By players
An similar analysis to the analysis By Skill, but with the difference that the sorting is done first on players and then on volleyball elements.
7.4. By rotations
This analysis allows you to generate team statistics broken down by rotation, and elements.
7.5. Attack directions
It shows the attack directions of the selected team with the selected filters. Analysis shows the attack directions from the left, right, and center of a court for each rotation. The report creates the directions according to the zones assigned to them. There are numbers next to the arrows, which have the following meaning:
- start zone
- top right corner – points lost when attacking from this zone,
- top left corner – points scored when attacking from this zone,
- bottom left corner – total number of attacks from this zone,
- bottom right corner – percentage of attacks from this zone,
- end zone
- top – total number of attacks to this zone, from the starting arrow zone,
- bottom – effectiveness of the attack,
Attacks from the offensive line (zones 2,3,4) are green and from the backrow are (zones 1,6,5) blue.
7.6. Directions of service
Similar to the previous one is the analysis with directions of service. Services from zones 1 and 5 are pink. The ones from zone 6 are blue, and the ones from zones 9 (between zones 1 and 6) and 7 (between zones 5 and 6) are green. In this analysis, we see a separate pitch for each player serving. In the starting zones:
- blue color shows the total number of attempts,
- green color shows the # effect, i.e., service aces,
- red color shows plays with the = effect, i.e., errors,
In the end zones you can see the total services to the zone (at the top), and it’s efficiency (at the bottom).
7.7. Distribution by setter calls
This analysis allows for setter distribution analysis in the side out phase. It’s divided in two sections: General distribution and Distribution by Rotation. The first one shows distribution based on the reception effect (rows). The second section is split by rotation. In both sections you can find these courts:
- Total – a court with a total numbers. It’s a sum of each of the setter calls,
- E3 – setter distribution when set is in zone 3,
- Setter call (K1, K2, K7…) – the following courts present the setter distribution based on a setter call.
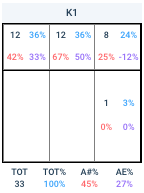
On each of the courts you can find four parameters:
- black color shows the total number of attacks in this zone,
- blue color shows the percentage of attacks in this zone,
- red color shows the effectiveness of attack in the zone,
- purple color shows the efficiency of attack.
Under the courts, you can see numbers for a whole section. Moreover, on the pink background may appear a setter attack if any.
7.8. Distribution by setter calls in transition
Similar analysis like the one above, but for a break point phase.
7.9. Efficiency over time
Efficiency over time analysis allows to understand trends of each element. To understand it well, we suggest using filters and selecting the element and players we want to break down. Analysis is divided into three parts. The first one is the line chart. On the x axis, you can see the amount of balls. On the y axis, you can see the efficiency (between -100 to 100%). The blue line shows the teams’ efficiency at a given moment. If we hover the mouse cursor over the blue line, we can see the score and the effect of the attack at that time. The colored lines show the individual players’ efficiencies.
Second part of the analysis is the bar chart showing the efficiency of the element for each player. Number above each bar shows the efficiency.
On the both line and bar chart, you can see a gray line that represents the average efficiency at the end of the set.
Third part of analysis is the stacked bar chart. On the x axis, you can see the number of a player. On a y axis you can see the amount of total attempts break down by an effect.
The efficiency over time report is limited to a single set. Choosing two or more games will result in a breakdown of every single set individually.
7.10 Combination by player
Combination by player allows for a team or a player attack breakdown based on an attack combination. The table is divided into sections, each for a different attack combination. Below, you can find an explanation for each of the columns:
- Tot – total amount of attacks,
- Pts- total amount of kills (# effect),
- Pts%- kill percentage (# effect),
- E%- efficiency,
- Blo%- percentage of blocked spikes (/ effect),
- Err%- percentage of errors in spikes (= effect).
7.11. Heat maps
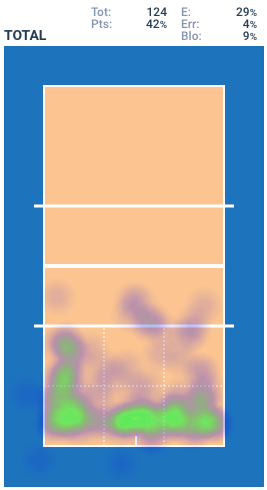
Heat maps is a functionality similar to attack directions and service directions reports, but much more precise. We suggest using it in the first place. To create a heat map it’s necessary to select the Skill filter. Generating a heat map will move you to the screen with a single court, where:
- Tot – means total amount of searched plays,
- Pts – total amount of # effect,
- E – efficiency,
- Err – total amount of = effect,
- Blo – total amount of / effect.
Depending on the selected skill, you can choose a different breakdown:
- Combination – will breakdown Attack skill to attack combinations, and Set skill to setter calls. Each combination is shown on a separate court.
- Skill type – will breakdown selected skill depending on it’s type. For attack it’s a breakdown for a high ball (H), tense ball (T) and so on. For service it’s a breakdown for a float service (M), and jump service (Q).
- Ball type – will breakdown the attack skill into hard spikes (H), soft spikes (P) and tips (T).
Visualization section:
- Heat map – is possible to use if you are using precise xy coordinates in your scout files (VM files have the precise points).
- Subzones – is showing the density of plays (similar to heat map) in a form of squares. You don’t need to have precise xy coordinates to use this visualization.
- Arrows – is showing arrows based on xy coordinates.
- Arrows from zones – is showing arrows based on the zones and subzones. You can find more information about this visualization in chapter 12.9.2.
- Effects – is showing the effects of every play on a court. You can select multiple effects at once.
- Start – shows the starting points of a selected skill.
- End – shows the end points of a selected skill.
On the right side you can select No background color style to make the court black & white.
7.12 Video Montage
You can prepare a video montage by selecting filters (explained in the next section), edit it, and later export. After generating a video montage, VolleyStation will show you a window with a list of codes on the left, and the video on the right.
![]() Single plays show us only the searched plays, while Full rallies show us rallies with the search code inside
Single plays show us only the searched plays, while Full rallies show us rallies with the search code inside
![]() In this panel, you can select how many seconds before the searched code video should play, and how long it will last
In this panel, you can select how many seconds before the searched code video should play, and how long it will last
Unselecting the play by clicking the checkbox on the left (shortcut: R) will delete a video from the exported video montage (it will turn gray). Later, you can see the searched play with all the information about start and end zones. Next to it, you can see the rotations of both teams, opponent, set, score
In the further section you can see six small tiles we call flags. You can select them by using numbers from 1 to 6, or by clicking flags with the left mouse button.
 Export clip allows saving a single rally. Clicking it will open a pop up window with Fast, no overlay or With overlay option. The With overlay option exports the video with the rotation information, set, score and the opponent name.
 Open match opens a window with details of plays before and after the selected plays. You can edit plays in this window.
 Export allows you to create a video montage file with all the plays from the list on the left. After clicking it, the following window pops up:

In this window you can choose what Clip type you want to export. You can select if you want to export a video with overlay. Creating a video with overlay increases the time of the export. Under elements you can select the export of All plays (even the unchecked ones), or Selected plays (without unchecked plays).
Flag sections show you how many, and which flags have been selected. By pressing and moving flags we can change its order. Again, you can select how many seconds before the searched code video should play, and how long it will last. After setting up our video montage parameters, we can press the Generate button and select where to save the video.
7.13. Filters
7.13.1. Skill
Skill allows you to select the volleyball skill we want to analyze. We can select only one element at a time.
7.13.2. Players
Players opens a list with the player numbers of a selected team. You can select more than one player.
7.13.3. Setter on court
This option allows to analyse plays only when a selected player/s were selected as a setter.
7.13.4. Effect
We can choose one or more effects of the chosen skill
7.13.5. Court position
It’s a much more advanced filter that allows you to select rotation (Z. squares) and what players were on court. Players section allows you to analyze plays when selected players are present on the court. Any order looks for a player on the court, while Selected order looks for players in specific positions.
7.13.6. Part of match
Allows you to select one or more sets. You can also select points in a different point range.
7.13.7. Setter call
Allows choosing one or more setter calls used in play. More about setter calls in section 3.2.
7.13.8. First ball or transition
Allows to select plays in a first ball side out or transition.
7.13.9. Point difference
In VolleyStation PRO, you can select what was the point difference. It’s crucial when analyzing your opponent. With this filter you can get rid of analysed rallies when score was e.g. 24-11, and analyse plays with the small point difference. Look at the example use of this filter on the right side of the pop up.
7.13.10. Set from zone
You can select that setter was setting a ball from a selected zone or subzone.
7.13.11. Reception effect
This filter allows you to select what was the reception effect in the play. It’s useful to use with the Setter call distribution report.
7.13.12. Type of reception
Type of reception filter allows you to select on which side of the body receiver was passing a pall.
7.13.13. Set effect
Similar to the Reception effect, you can select what was the effect of a set.
7.13.14. Analyzed team
It allows the user to apply the selected filters to the selected, opponent, or both teams.
7.13.15. Ball type
Allows you to select the type of a skill.
7.13.16. Skill type
Skill type varies depending on the selected skill. For attack we split it into Hard spike (H), soft spike (P) and tip (T).
7.13.17. Blocking players
You can choose the number of blockers (for attack and block), or the reception system used by a team.
7.13.18. Start zone
You can select the starting zone of the selected element. It’s possible to select any zone or subzone. It varies in service, where zone 9 is a zone between zones 1 and 6, and zone 7 is between zones 6 and 5.
7.13.19. End zone
Similar to the previous filter, but here you can specify the end zone of a play.
7.13.20. Combination
Allows you to select attack combinations for analyzed reports.
7.13.21. Result of set/exchange
You can choose if you want to analyze only sets won/lost or only points won/lost. It is possible to create combinations of both conditions.
7.13.22. VolleyStation Query
VolleyStation query allows you to type in any phrase as you write it down when you code the match. For example, typing *2SQ- will give us back all plays by the number 2 player of the selected team (*2) who plays a jump service (SQ) with a minus effect. You can also use filters that are listed in the section “Filters” (chapter 12.8). It is important that the basic play and the filters are separated by semicolon (;). For example: *2SQ-; PR20:*.
7.13.23. +
If the above filters do not include the expected option, use the special filter marked “+”. It allows you to enter any code that may apply to the whole action, a part of it, or just the play. This way you can analyze previous or next actions. For example, this is useful to verify a setter distribution when there was an error in his team’s offense in previous actions.
8. Preset group
Preset groups allow you to prepare analyses ready for use at any time with a single click. Clicking on the Preset Group icon on the left side of the main window will move you to the list of your preset groups. If you are getting started with VolleyStation, there are two default preset groups inside. To create a new one, click New preset group, enter a name for it, and select a default season, team, and matches. To add a report to the preset group, press the Add preset button at the bottom of the page. Then type in the name of the analysis and select its type and filters, and press save. You can find more information about reports in chapter 7. You can add another preset at any time by starting the process with the Add preset button.
Created presets can be either graphical reports or predefined video montages, which you can then generate to an external file or open the video preview in a new tab (similar to the image below).

9. Bench
VolleyStation allows you to send real-time data to other devices. Bench mode is used for this purpose. In order to use it, you need to create reports. To do this, simply use the New bench function and follow the process described in the Preset groups. You can also use spreadsheets on the bench. To allow this, you need to open a spreadsheet and press the On bench checkbox.
To open a bench in a web browser, it is necessary to open a match window, and select Connect tablet’ from the left side panel. A pop up with a QR code and IP address will appear. Scan the QR code with your tablet to open a webpage with a bench mode.
Please note, that the connected devices must be on the same network as the data source, which is usually the technical coordinator computer. NOTE: Bench mode requires a device with at least 767 pixel width.
10. Video Analysis
The Video Analysis button will open a window with a text box at the top. Below that, a blank list will appear on the left and a video window on the right. First, select the season, team and matches you want to analyze. After that, you can start inputting the VolleyStation Query command in the text box to watch a video. You can do this in the same way as coding in the match window (section 6.3.4.) or using the filters described in the spreadsheets chapter (12). E.g. typing *S will display all services of the selected team. Here we can also add filters, as well as VSAND, and VSOR conditionals. Please note, that the main code (e.g. *S) and subsequent filters must be separated by a semicolon mark (;).
Video analysis view also contains options described in Video Montage chapter (7.12). Using the Save as report button allows you to save the search in a new window as a video montage. Any applied changes to the list on the left will also be saved.
There is also a Use Filters button on the right that allows you to select filters using the tiles already familiar from the Reports / Montages tab.
11. Rotation Planner
The rotation planner is a feature that allows you to analyze your opponent’s lineup to see where your team will start in each set. To do this, fill out the Team A and Team B text boxes and players in specific zones (Z1, Z6, Z5, etc.). On the left side, select the serving team. The + and – buttons change the rotations for both teams. Created rotation planner can be exported to a .pdf file through the Print option.
12. Spreadsheets
Spreadsheets available in VolleyStation PRO change the way of analysis and reporting. They allow you to access raw numbers with a flexibility that was previously unavailable, but also to visualize data directly in the spreadsheet. They are a much more advanced method of analysis than previously described reports. When you first install VolleyStation on your computer, under the Spreadsheets tab, you’ll find built-in sheets prepared specifically for you. There are also Tutorial spreadsheets that describe the use of the built-in features in more detail. If you don’t find them there, please download them manually from the link and use the Import option under the spreadsheets tab. At VolleyStation, we have prepared our own functions, and their description is below. The spreadsheet in the program works similarly to external programs (such as MS Excel or Numbers). To use a function in a spreadsheet, start typing with ‘=’ and then add its name. When we designed our Spreadsheets, we wanted to make it easier for coders, that’s why inside the formula string you can use the same codes you would use to code match. When working on spreadsheets, in addition to the familiar keyboard shortcuts, there is also a combination of ctrl (cmd) + S to save the changes made.
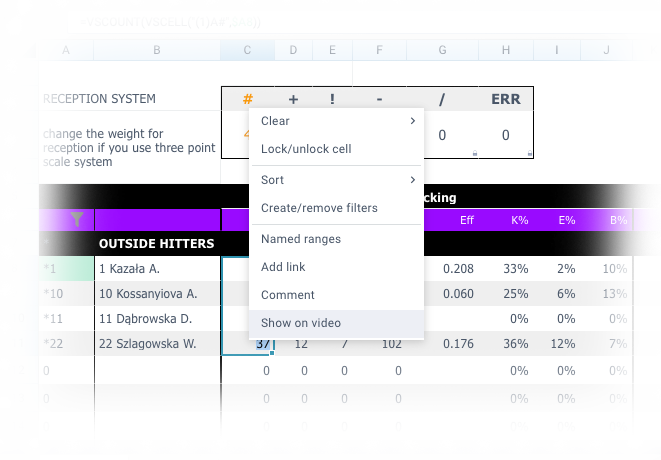
A very practical feature that simplifies the use of VolleyStation and speeds up work time is the option to show the contents of a selected cell in a video analysis. To do this, use the right mouse button on the given cell and select the “Show on video” option.
12.1. VSCOUNT
A simple function that returns the number of written code. By typing =VSCOUNT(“*R#”) VolleyStation returns the number of perfect receptions of the selected team. You can extend the string inside the quotation marks by adding more filters. For example:
- =VSCOUNT(“a12R#”) → returns the number of perfect receptions of the player with the number 12 of the opposing team,
- =VSCOUNT(“a12A#”) → returns the number of kill attacks of the player with number 12 of the opposing team,
- =VSCOUNT(“*12X5#”) → returns the number of X5 kill attacks of the player with number 12 of the selected team,
- =VSCOUNT(“*12A#41”) → returns the number of kill attacks (from zone 4 to zone 1) of a player with the number 12 of the selected team.
Similar to coding, you can use commas in a string. A single use of it between quotation marks will move us to extended codes. There is a fundamental difference between =VSCOUNT(“*AH”) and =VSCOUNT(“*A,H”). The first formula returns the number of high ball attacks of the selected team, while the second formula returns the number of hard attacks of the selected team. Second comma in a string will move you to the custom codes.
- =VSCOUNT(“*A,,ABC”) → returns the number of the selected team’s attacks where ABC was entered in the custom code,
- =VSCOUNT(“*A,,__X__”) → returns the number of the selected team’s attacks where X is entered in the custom code in the third place.
12.2. VSPER
A similar function is VSPER, that allows you to return a percentage value of the selected effect. =VSPER(“*A#”) returns the attack kill percentage of the selected team. The code can be extended, as the VSCOUNT function.
12.3. VSEFF
The VSEFF function allows you to return the efficiency of an element. =VSEFF(“*1S”) returns the efficiency of the service of the player with number 1 of the selected team. The code can be extended, as the VSCOUNT function.
12.4. Funkcje logiczne (VSOR, VSAND, NOT)
We prepared logic functions in VolleyStation spreadsheets that allow you to use OR, AND, and NOT logical operators. For example:
- VSOR allows you to include the condition that one of the following plays happened. E.g. VSOR(“*R#”, “*R+”), looks for a perfect OR positive reception by the selected team. =VSCOUNT(VSOR(“*R#”, “*R+”)) will return the number of perfect or positive receptions of the selected team.
- VSAND – allows you to include a condition that both factors indicated have occurred. Please note, that you have to use the P, R, or B filters to make it work. This function works analogously to VSOR and can be expanded in the same way.
- NOT – we can also add a NOT filter separated by a semicolon to negate a second inquiry. For example, VSAND(“*A”, “*A=;NOT”) will return all attacks without errors.
12.5. CELL
The VSCELL function allows you to reference data contained in other cells. For example: VSCELL(“*(1)A”, A35) will return attacks of the selected team, and will reference a player number in cell A35.
12.6. Filtering surrounding actions
There are several methods for determining surrounding plays relative to the first one. We can divide these filters into rally (R), play (P) or ball possession (B).
12.6.1. Rally
To refer to the whole rally use the R (rally) after the semicolon. A good example is the function =VSCOUNT(VSAND(“*A#”, “*A#;R-1”)), that returns the number of scoring attacks when in the previous action (R-1) the selected team scored a point with an attack. The reference to the previous action is R-1.
12.6.2. Play
With P (play) we can refer to a specific play. For example =VSCOUNT(VSAND(“*A=”, “*E#;P-1”)) will give the number of attack errors of the selected team when a # set (E#) occurred one play before it (P-1).
12.6.3. Ball possession
Filter B (ball possession), allows to refer to the rally phase. E.g. =VSCOUNT(VSAND(“*A”, “*R;B-0”)) means all attacks of the selected team when reception was in the same ball possession sequence (B-0).
12.7. Help functions
VolleyStation also has several helper functions to enhance the display in spreadsheets. These include:
- VSPLAYER → will give us the player number in the team list. In this way, the function =VSPLAYER(“*1i”) will show us the number of the first player in the selected team roster. The function =VSPLAYER(“*1i”, “setter”) will give the number of the first player in a roster that is a setter. In order to use this function correctly, it is necessary to specify the position when creating or editing a team, as indicated in section 4.2.
- VSPLAYERNAME → will give us the name of the player. Using the function =VSPLAYERNAME(“*11”) will display the player with the number 11 of the selected team.
- VSTEAMNAME → will give us the name of the selected team. E.g. =VSTEAMNAME(“*”) returns us the home team name. It is also possible to use =VSTEAMNAME(“a;M1”), which will show the name of the opponent from the first (last) game in a selection.
- VSSETCOUNT → counts the number of sets played. We can determine the number of sets played by the player with the number 1 of the selected team, by the function =VSSETCOUNT(“*1”). You can also extend this to include sets won when the player with the number 1 was on the court: =VSSETCOUNT(“*1W”). To specify lost sets simply replace ‘W’ with ‘L’.
12.8. Filters
We can also add specific filters to codes. Their order does not matter and will always be interpreted appropriately by VolleyStation. After inputting the basic code, use a semicolon, and enter filters. We separate consecutive filters in the same way. E.g:
- =VSCOUNT(“*A;*Z234;aZ561”) → returns the number of attacks of the selected team (*A) when home team was rotations 2,3 and 4 (*Z234) and the opposing team was in rotations 5,6 and 1 (aZ561),
- =VSCOUNT(“*A;PA1:*”) → returns the number of attacks of the selected team (*A) when their point advantage (PA1:*) was higher than 1,
- =VSCOUNT(“*A;PA-1:1”) → returns the number of attacks of the selected team (*A) when the point difference between teams was 1 or less (PA-1:1),
- =VSCOUNT(“*A;PR20:*”) → returns the number of attacks of the selected team (*A) after the 20th point of one of the teams (PR20:*),
- =VSCOUNT(“*A;S1”) → returns the number of attacks of the selected team in the first set (S1),
- =VSCOUNT(“*A;SL”) → returns us the number of attacks of the selected team in the last set (SL),
- =VSCOUNT(“*A;LR-1”) → returns the number of attacks of the selected team when the previous rally was lost (LR-1),
- =VSCOUNT(“*S;LS-0”) → returns the number of plays of the selected team in the lost set (LS-0),
- =VSCOUNT(“*A;*PC16,21”) → returns the number of attacks of the selected team when players number 16 and 21 were on the court (*PC16,21),
- =VSCOUNT(“*A;*PO21,,16”) → returns the number of attacks of the selected team when the player with number 21 was the setter and the player with number 16 was two zones away. PO stands for a specific player order. In this filter after the team prefix (* or a) and PO, there is a space to specify the setter, and each subsequent player is separated by a comma. The order of the players is therefore specified as if they were in the first rotation. VolleyStation automatically adapts the order for further rotations,
- =VSCOUNT(“*11A;PZ432”) → returns the number of attacks of the player with number 11 of the selected team in zones 4,3 and 2 (PZ432),
- =VSCOUNT(“*A;*PS12”) → will give us the number of attacks of the selected team when the setter was player number 12 (*PS12),
- =VSCOUNT(“*A;M1”) → will show us the number of attacks of the selected team for the first (last) match in selection (M1).
12.9. VSCOURT
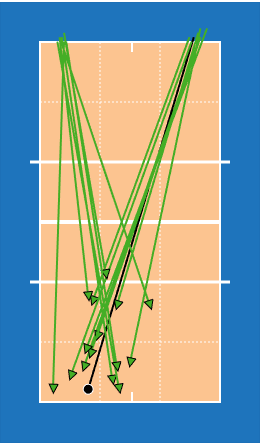
VSCOURT returns a court from the Heat Map report. This function works in an analogous way to the previously mentioned. Entering the function =VSCOURT(“*2S”) let you display a court with arrows that reflect the direction of the service (S) of the player with the number 2 of the selected team (*), as shown in the image below.
12.9.1. Court size
You can change the court size obtained by the VSCOURT function. To do this, simply add to it the appropriate scale relative to the original size. For example, =VSCOURT(“*2S”,0.5) will present a court half the size, while =VSCOURT(“*2S”,2) will make it twice as large.
12.9.2. Data visualization
As in heatmaps (chapter 7.11.), the visualization of data in VolleyStation can be made using heatmaps, arrows, subzones, arrows from zones or effects (#,+,!,-,/,=). E.g. to get a heatmap of the selected team’s attacks, simply type the function =VSCOURT(“*A”, “heatmap”). To combine multiple layers of data, write them after a comma. A heatmap of the selected team’s attacks with the # effect attacks selected can be generated by =VSCOURT(“*A”, “heatmap,#”).
If you are using only zones and/or sub-zones to mark event directions, then you can also use the Arrows from zones, which is less precise than using manually created arrows, but allows for clearer representation of directions. The start and end points of the arrows from zones have been randomly scattered within the entered zone or subzone. To make zone arrows visible, use the zoneArrows filter (e.g. =VSCOURT(“*A”, “zoneArrows,#”)). Zone arrows also work with the VSFORMAT function just like regular arrows (chapter 12.9.5.). It is possible to use zoneArrows and other ways of presenting data.
12.9.3. Start and end
Using the VSCOURT function allows presenting the start point and/or end point. The function =VSCOURT(“*A”, “heatmap”, “start,end”), returns the attack of the selected team. On the court will be shown both the start points (where the skill was played from) as well as the end points (where the skill was played to). If only the end point is to be shown, then only “end” should be entered.
12.9.4. Print
Using “print” inside the parenthesis allows the court to be represented in black and white. For example =VSCOURT(“*A”, “#,/,-,+,=,!”, “print”) will be represented as:
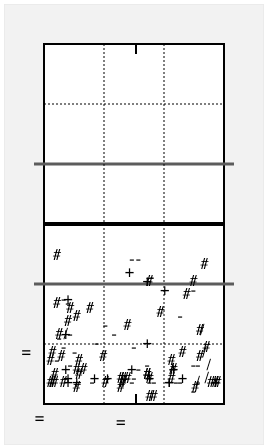
You can use all the above heatmap filters in one query. E.g =VSCOURT(“*A;PR20:*”,1.5, “heatmap,#”, “start,end”, “print”) will show us the selected team’s attacks after the 20th point of any team in a set (“*A;PR20:*”). The court will be represented at a scale of 1.5, with both the start and end points (“start,end”) appearing as a heat map (“heatmap“), on a black and white court (“print”).
12.9.5. Formatting Data in VSCOURT via VSFORMAT
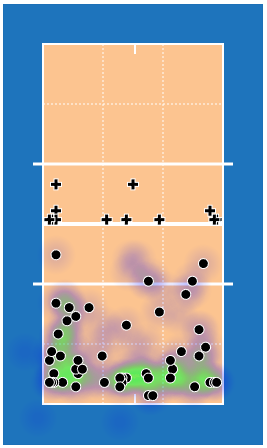
To organize the data and improve its readability, we have also added the VSFORMAT function. This is a separate function that works only inside the VSCOURT function. It allows you to specify the type of line, start and end symbol, as well as the colors. In addition, it can be used multiple times within the VSCOURT function. For example, the function =VSCOURT(“*A”,”heatmap,arrows”,1.5,VSFORMAT(“”,”line-style:none,end-style:none”),VSFORMAT(“*A#”, “end-style:circle,start-style:plus”),VSFORMAT(“*X5#”, “start-color:red,end-color:red”)) displays the court below. The court shows attacks of the selected team (“*A”), using heatmaps and arrows (“heatmap,arrows”), at a scale of 1.5. Besides that,
- VSFORMAT(“”,”line-style:none,end-style:none”) shows all (“”) plays indicated in the VSCOURT(“*A”) function, where the line and end point are not visible (“line-style:none,end-style:none”),
- VSFORMAT(“*A#”,”end-style:circle,start-style:plus”) formats kill attacks of the selected team (“*A#”), so the end point is a circle and the start point is a plus (“end-style:circle,start-style:plus”),
- (VSFORMAT(“*X5#”,”start-color:red,end-color:red”) formats X5 kill attacks of the selected team (“*X5#”), so the start point and end point are marked in red (“start-color:red,end-color:red”).
The VSFORMAT function allows you to use:
- colors:
- red,
- green,
- blue,
- yellow,
- cyan,
- magenta,
- black,
- line styles:
- line,
- dashed,
- dotted,
- none,
- end/start lines:
- cross,
- circle,
- square,
- arrow,
- diamond,
- plus,
- none.
We recommend examining the Formatting tutorial spreadsheet for more information about VSFORMAT function.
13. Video converter
This functionality allows VolleyStation to convert video files. If you have out of sync problems or experiencing other video file issues while creating video montage, converting the video file may help. To convert a video, choose the file to convert, then select a resolution, frames rate, and a file quality. You can convert a video with or without a sound. After using the converter, the files are saved in .mp4 format.
14. Merge video
VolleyStation has the functionality to merge multiple video files into one. To do this, select the files you want to merge and confirm by pressing the Merge button. This feature is designed to merge video parts returned by cameras. Merging files in different formats, may cause errors and return unreadable file.
15. Send statistics
This functionality is dedicated for users who have the key for sending statistics to appropriate servers. It can be used in organizations (leagues) which are supported by VolleyStation. To send statistics just type in the alphanumeric key and then select the file from your computer and use the Start option. NOTE: If you are coding matches using VolleyStation, this functionality is also available in the match window and there is no need to attach a file from your disk.
16. Contact Information
We have done our best to make this document as clear and understandable as possible for every VolleyStation PRO user. However, if something remains unclear, please contact us at contact@volleystation.com. We encourage you to send us your suggestions concerning the development of the program.
At https://blog.volleystation.com/volleystation-pro-changelog/ you can find the list of the recent changes done in VolleyStation PRO.
Was this article helpful?
That’s Great!
Thank you for your feedback
Sorry! We couldn't be helpful
Thank you for your feedback
Feedback sent
We appreciate your effort and will try to fix the article