Basics of play by play analysis
- VSPLAYS – this function is similar to
VSCOUNT, and in play by play analysis, it’s the source of data for our play sequences. - VSRANGE – you can limit the sequence length by using
VSRANGE. - VSMAP – Limiting play code, to only desired values is done using
VSMAP
Your sequences are not limited to one piece of data at the time.
=VSMAP(VSPLAYS("*A;PR20:*;S1"),"player,combination,effect")

Here you can see VSPLAYS being the source of data for VSMAP. VSMAP then translates each play into player number, combination and effect. Outside of those new function names, filtering remains unchanged compared to what you used before. Below is the list of all the details VSMAP can get out of each play:
- team
- player
- skill
- hitType
- effect
- combination
- targetAttacker
- startZone
- startSubZone
- endZone
- endSubZone
- skillType
- players
- special
- custom
Be advised that not all fields have to be present for each play.
Advanced analysis
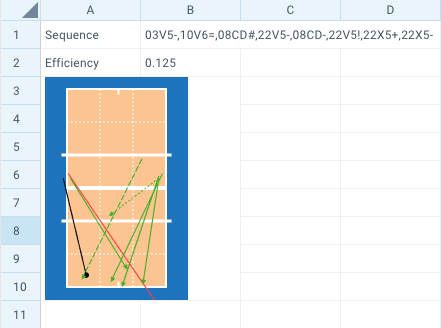
We’ve mentioned before that more advanced play by play analysis options are available when using VSRANGE. Let’s go over an example of that.

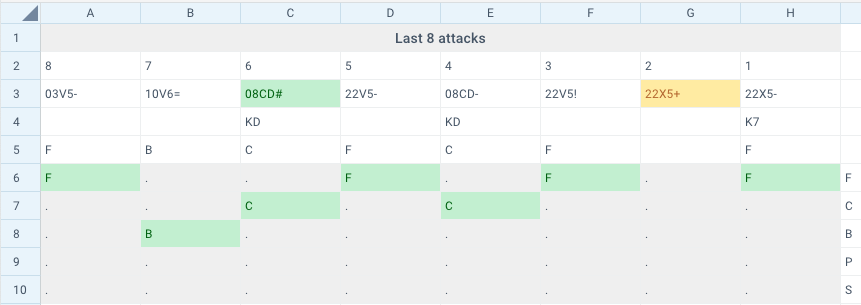
Here we have a table, that focuses on the same 8 last attacks as examples before. This time however we split those attacks in cells, allowing for some better data display, and conditional formatting.
First row contains attack indexes from 8 to 1. We will use those values later, to make our spreadsheet more dynamic.
Second row is composed of functions following this syntax
=VSMAP(VSPLAYS(VSAND("*A;PR20:*;S1","*E;B-0"),VSRANGE("8:8L")),"player,combination,effect")This function is the same function we analysed before, but this time it’s using additional VSRANGE("8:8L") fragment. This fragment will limit the amount of plays we feed into VSMAP for display. VSRANGE can take many different parameters:
- 1:5 – We take first 5 plays from all matching the filters.
- 1:5L – We take 5 plays again, but this time from the end of the list.
- 3:3 – Take takie third play from the list.
- 5:* – We take all plays but skip first 4.
By using ranges including just one attack, we managed to get their data separately in each cell.
Rows 4 and 5 are also using VSMAP, but instead of displaying attack data, we display data for setting. This allows us to analyse not only the attack itself, but also the proceeding setup. In this case we show setter call and target attacker.
Rows 6 to 10, contain the same information as row 5, but we spread the values a bit, making it easier for you to spot any target attacker patterns.
Was this article helpful?
That’s Great!
Thank you for your feedback
Sorry! We couldn't be helpful
Thank you for your feedback
Feedback sent
We appreciate your effort and will try to fix the article